
Update: Added discussion on launch angle at the end of the post.
Edit: The final numbers in this post went through a few rounds of revision. What is the world coming to, when you have to track down missing factors of 2 in your blog posts?!
This week, I’m looking at the strategies and mechanisms by which different animals solve the problem of getting around. I started off by writing about how birds and aquatic animals conserve energy on-the-go. This post is another spinoff on the theme of locomotion.
Here’s a clip from one of my favorite documentaries, David Attenborough’s Life of Mammals. It shows the incredible sifaka lemur of Madagascar, a primate that has a really remarkable way of getting around. (If the embed doesn’t work, you can watch it here)
As they launch out from the trees, they almost look like they’re defying gravity. And so, taking inspiration from Dot Physics, I thought it might be interesting to put physics to use and analyze the flight of the sifaka.
I loaded the above video into Tracker, a handy open source video analysis software. I can then use Tracker to plot the motion of the sifaka. I chose to analyze the jump at about 21 seconds in. I like this shot because it isn’t in slow motion (that messes up the physics), the camera is perfectly still (we expect no less from Attenborough’s crew), and the lemur is leaping in the plane of the camera (there are no skewed perspective issues that would be a pain to deal with). The whole jump lasts under a second, but at 30 frames per second, there should be plenty of data points.
This is what it looks like when you track the sifaka’s motion:

The red dots are the position of the sifaka at every frame. That’s the data. In order to analyze it, we need to set a scale on the video. I drew this yellow line as a reference for 1 unit of size (call it 1 sifaka long). And how big is that?
If we believe this picture that I found on the National Geographic website, then a sifaka is about half the size of this folded arms dude.

Now, to the physics..
While the sifaka flies through the air, the only force acting on it is gravity, which points downwards. So the acceleration of the lemur should also be downwards. (I’m ignoring air resistance. We’ll find out if this is a good idea.)
If we plot its horizontal motion, it should be moving at a fixed speed, with no acceleration. But its vertical motion will give away its acceleration.
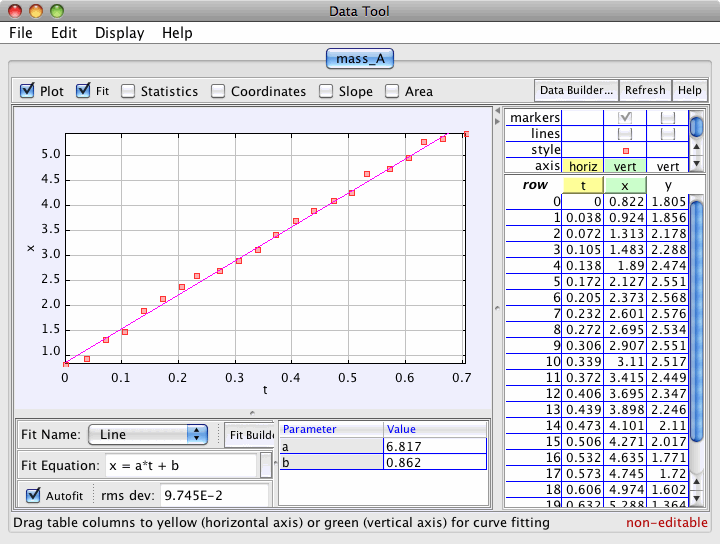
This is what we get if we plot at the horizontal position of all the points with respect to time.
 The squares are the data points, and the line is a plot of the equation of a straight line

I was amazed by how well they agree, since I expected air resistance to matter a little more. I guess ignoring air resistance is a pretty good approximation.
We find that there’s a straight line relationship between position and time, which implies that the sifaka moves at a constant speed in the horizontal direction. The slope of this line (
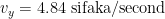
What about the vertical direction? Well, it certainly can’t be a straight line relationship with time, because at some point the sifaka turns and comes back down. Here is what the plot looks like:

The small squares are the vertical positions of the dots plotted versus time, and the red curve is the plot of an equation for a parabola
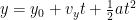
Here 


So, over time, the vertical position traces out a parabola, which is a characteristic shape for motion under a fixed acceleration (in this case, the earth is accelerating the lemur downwards). The nice thing about analyzing motion is that we can analyze the horizontal and vertical motion independently of each other.

The fit to the parabola is not great, but it’s not too shabby either. I suspect the main reason for the discrepancy is that its hard to track the center of mass of the sifaka, and if you choose any other place on the sifaka, you’ll also be tracking the spin of the sifaka about its center of mass.
By solving for the values of
To be a little more empirical about things, I did this analysis twice, and averaged the results. Here’s what I got:
Horizontal launch speed: 
Vertical launch speed:
Vertical acceleration:

The negative sign on the acceleration indicates that gravity is pulling the sifaka downwards (in the negative y direction). So far things look good qualitatively, but do the numbers work out?
 Well, according to National Geographic, the tail of a sifaka monkey is 46 cm, whereas according to wikipedia it is 50 to 60 cm. Let’s go with 50 cm on average. The length scale I drew in Tracker is about the length of the Sifaka’s tail. So we can set 1 sifaka = 0.5 meters.
That gives us a value of 


Next, we can use Pythagoras’ theorem in the above velocity triangle to solve for the total launch speed

where 

This gives a launch speed of 4.25 meters per second or 9.5 miles per hour (15.3 km/h). This speed sounds reasonable to me, as it’s about how fast your typical bicycle moves. If we include a fudge factor that fixes our acceleration to the known result, then the launch speed is actually faster by 16%.
Update: added discussion on launch angle.
We can also solve for the launch angle of the sifaka, by using some high-school trigonometry on the triangle:

Solving for the angle 
Is this angle correct? Fortunately, Tracker has a handy built in protractor, so we can check it. Marking out the initial leap for both runs, I get an average launch angle of 34.5 degrees.

Which agrees to within half a percent of our result inferred from the physics!! Eerily accurate..
It’s a bit of a coincidence that the result is as close as it is, given the many possible sources of error. However, one reason why this result is so accurate is that the angle comes from a ratio 
And there you have it folks, SCIENCE being put to use to answer the burning questions that keep you up at night.
If you want to read more about how the sifakas glide, Darren Naish has a detailed post describing research on the physics of this.